We use cookies

We use cookies and other tracking technologies to improve your browsing experience on our website, to show you personalized content and targeted ads, to analyze our website traffic, and to understand where our visitors are coming from.

Diego P.F. Trindade
  • Home
  • Publications
  • Posts
  • Presentations
  • CV
Categories
All (4)
biotime (1)
blogdown (1)
broom (1)
data cleaning (1)
data visualization (1)
dplyr (1)
ecology (2)
ggplot2 (1)
netlify (1)
purrr (1)
quarto (1)
tidymodels (1)
tidyverse (2)

Rstats posts

From Blogdown/Hugo to Quarto - deployed on Netlify

blogdown
quarto
netlify
I’m perhaps a bit late to the Quarto party, but, after some delay, I decided overcoming my laziness and started to migrate my old blogdown/hugo website to Quarto.
May 15, 2023
Diego P.F. Trindade

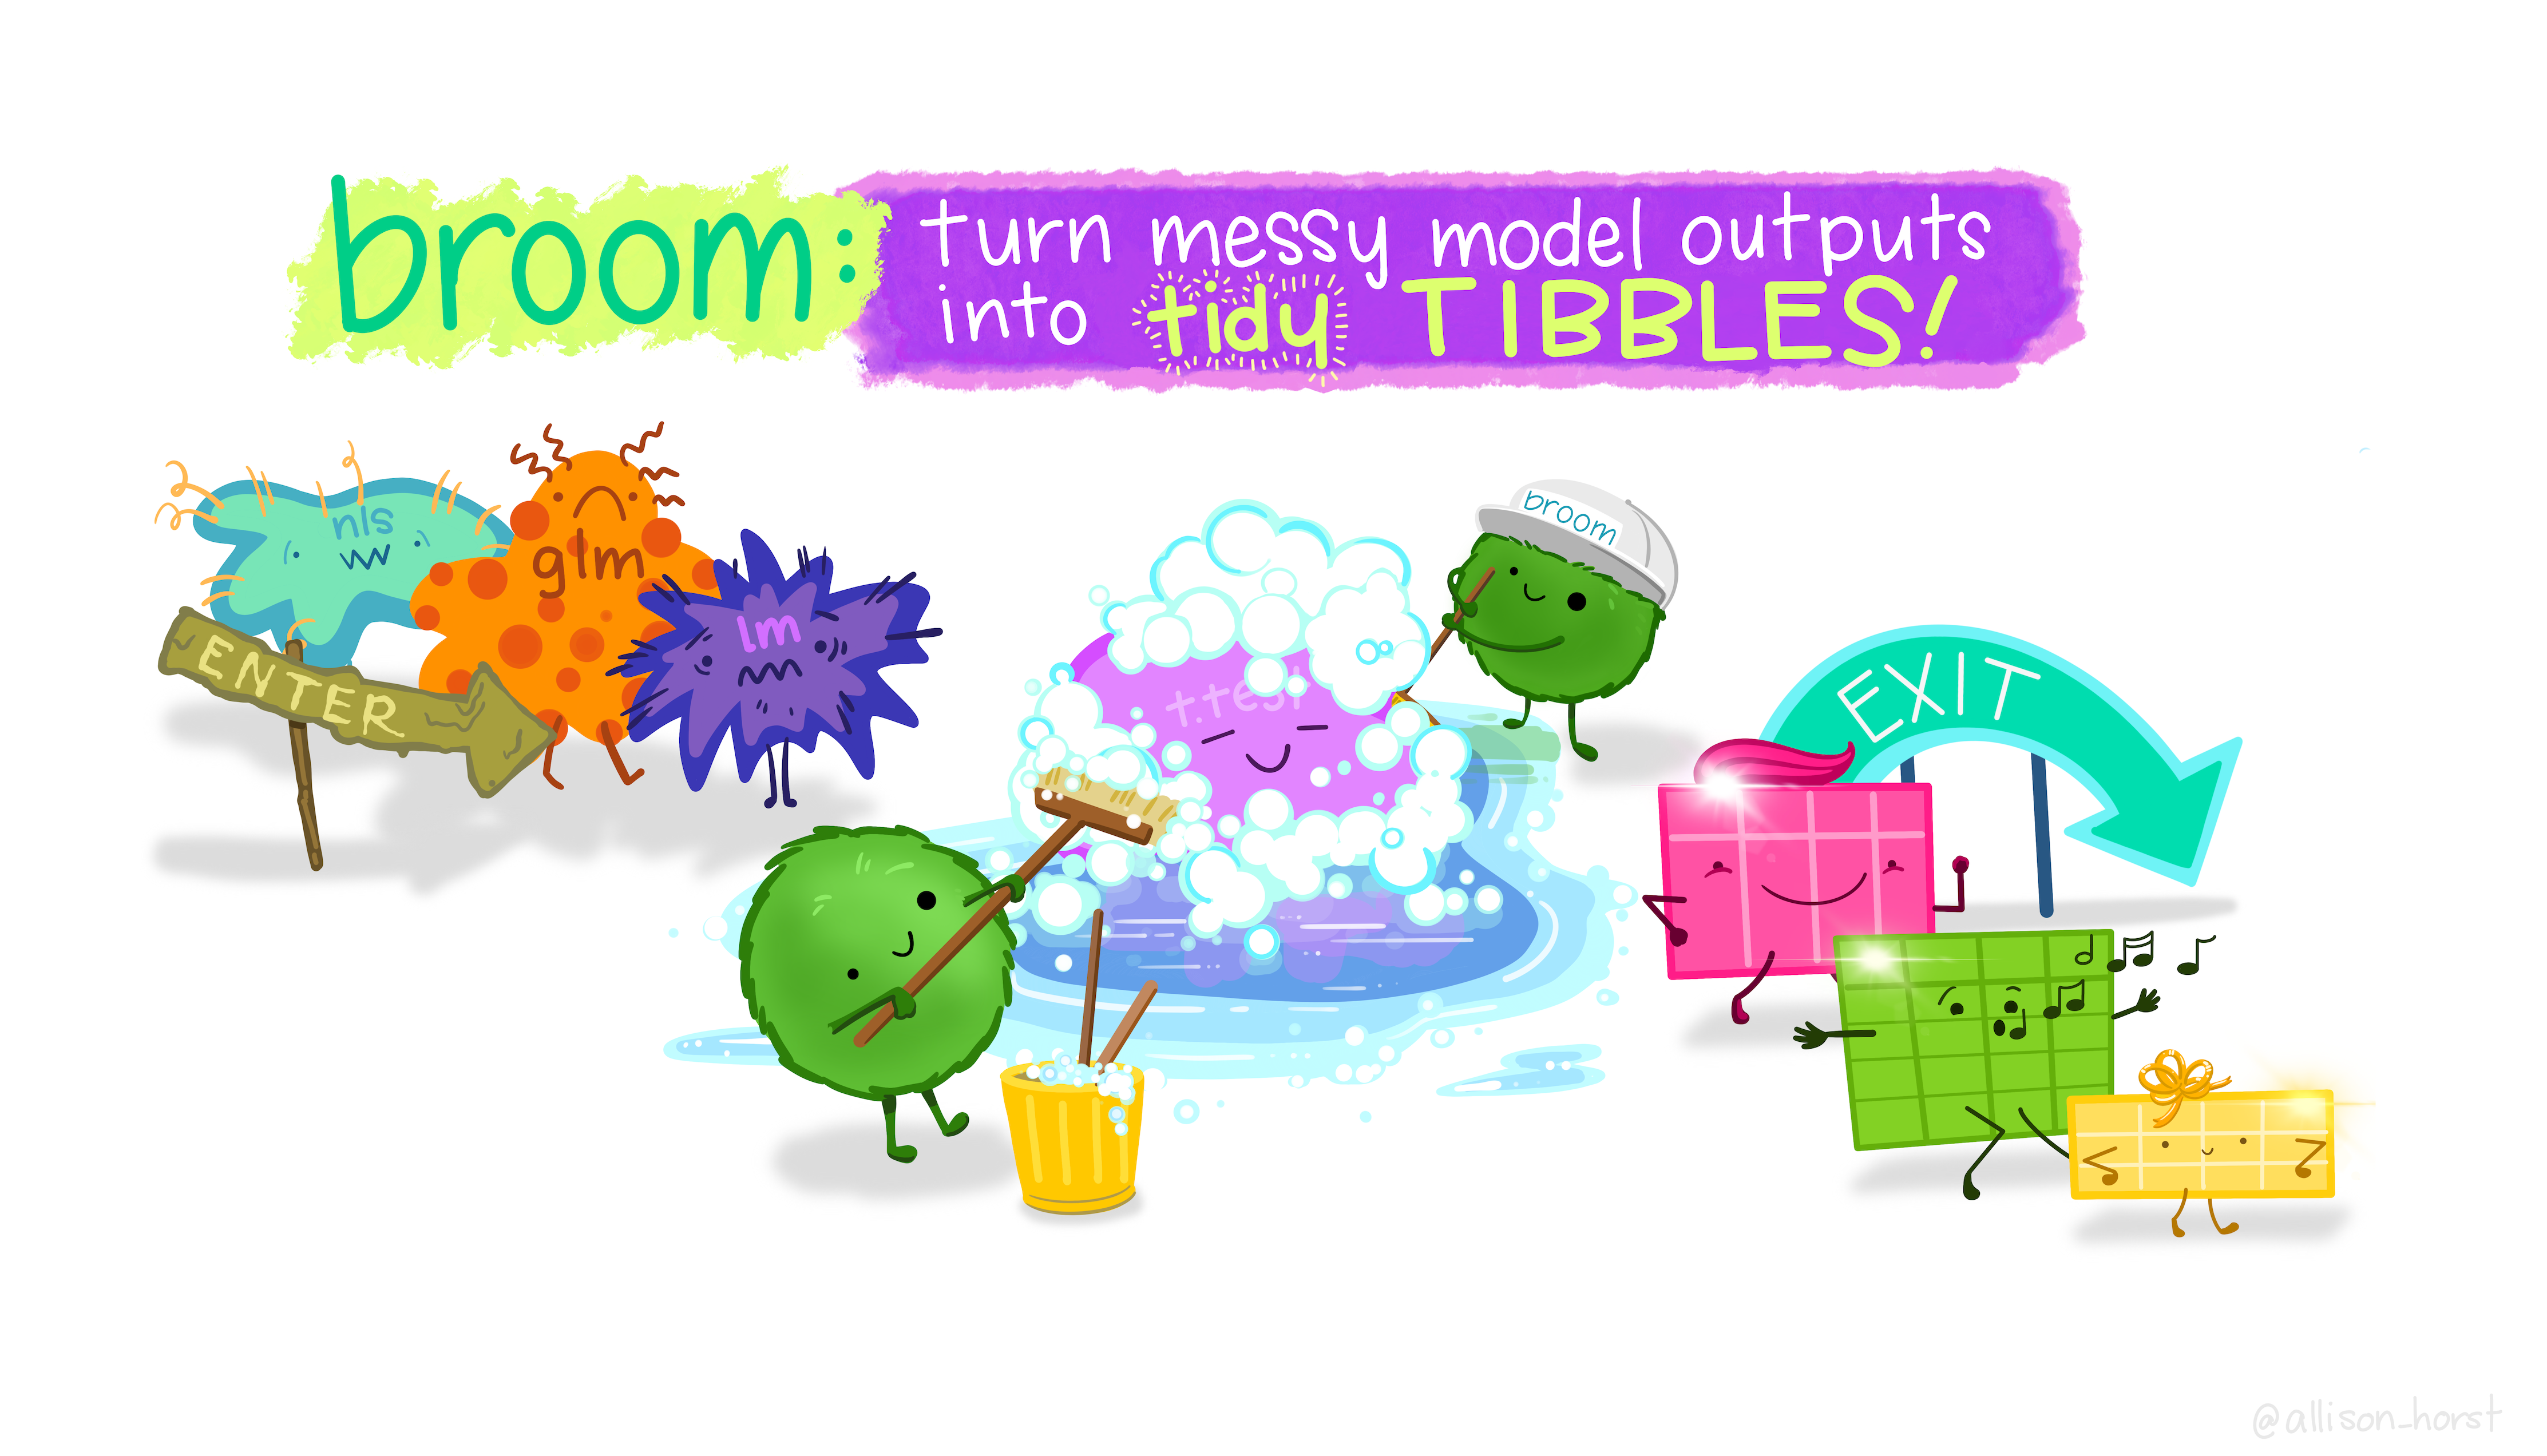
3 Statistical analysis in ecology with broom

tidymodels
broom
purrr
ecology
broom organizes the messy output we get from summary(model), giving us a tibble with different parameters present in our models. broom also supports working within lists, as we have seen in our previous posts. In short, when we need to perform several statistical analysis, with broom, we can nest the variables and run them all at once. To start, this package has three main functions tidy(), glance() and augment(). Each one gives us different parameters.
Jul 16, 2020
Diego P.F. Trindade

2 Data visualization with ggplot2

ggplot2
ecology
tidyverse
data visualization
Besides being able to clean and explore data in ecology, it is also important to know how to visualize and present the patterns you found. Here I’m gonna show very briefly how to create histograms, bar plots, box plots and scatter plots with ggplot2. Further, I’m going through how to combine different plots using cowplot. I will try to use the knowledge we gathered in our previous post, i.e. using dplyr and purrr functions.
Jul 15, 2020
Diego P.F. Trindade

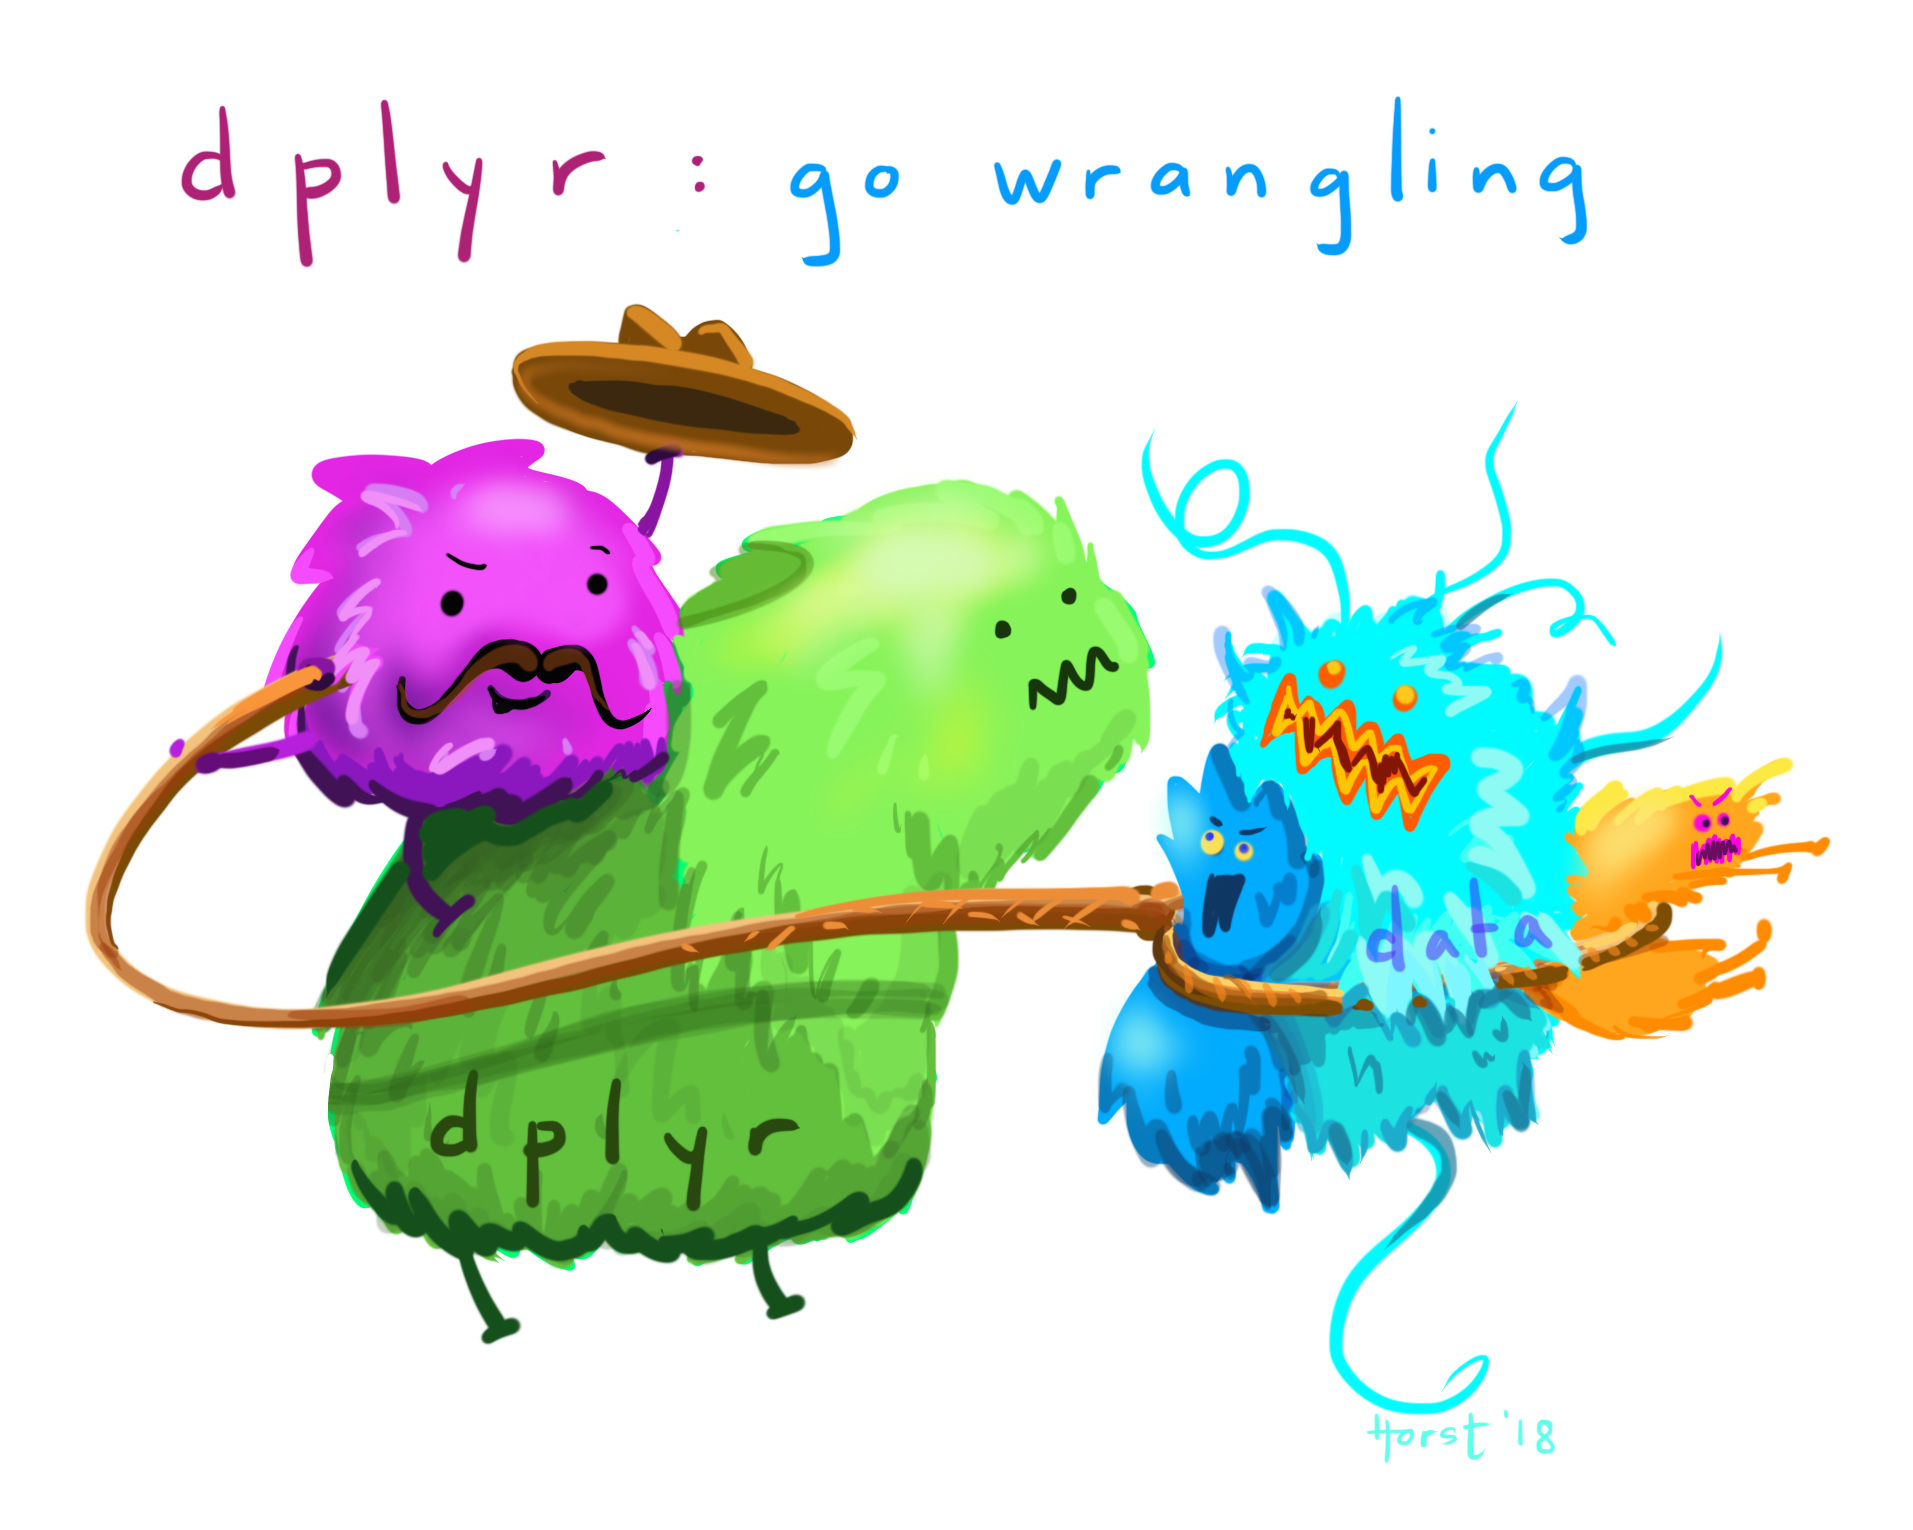
1 Data wrangling in ecology with tidyverse

tidyverse
dplyr
biotime
data cleaning
The amount of data becoming available in ecology has been increasing rather fast in the recent years. Therefore, being able to wrangling, analyzing and visualizing this data, associated with a good scientific question, is timely for ecologists. Here, I will introduce some tidyverse packages and functions that can make this part of the job a bit easier.
Jul 14, 2020
Diego P.F. Trindade
No matching items
 
Cookie Preferences