Diego P.F. Trindade
  • Home
  • Publications
  • Posts
  • Presentations
  • CV

On this page

  • Education
  • Publications
  • Posts

Education

PhD in Botany and Mycology | University of Tartu - Estonia

MSc in Plant Ecology | Universidade Federal de Pernambuco - Brazil

BSc in Biological Sciences | Universidade Estadual do Sudoeste da Bahia - Brazil

Publications
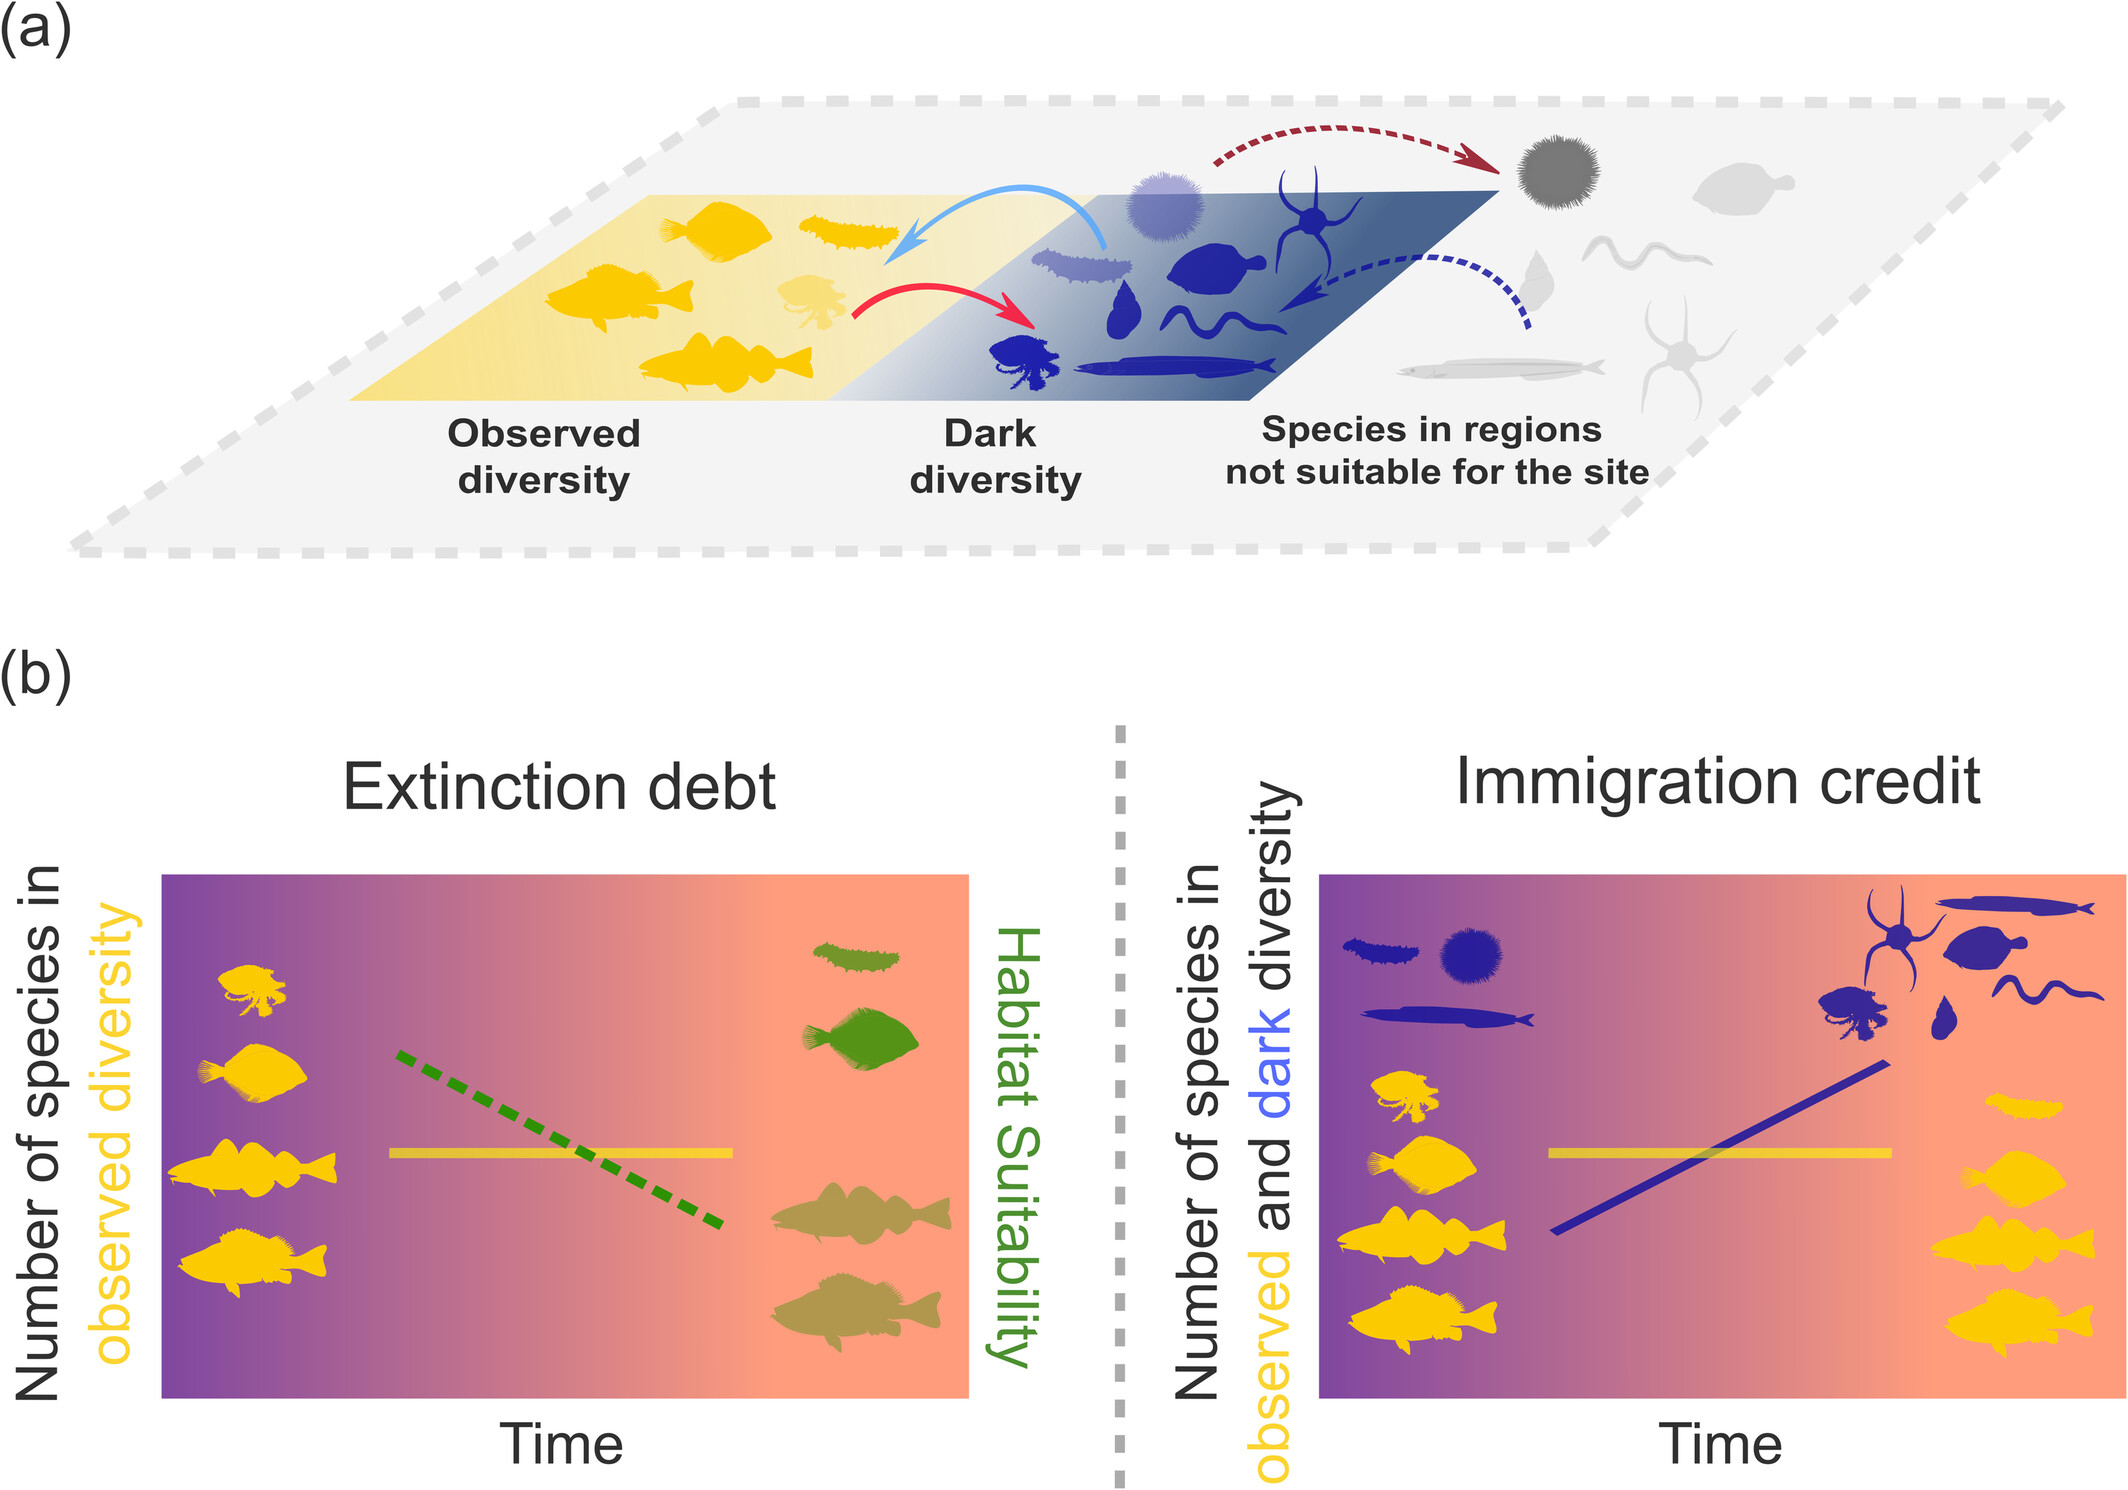
Trait‐Dependent Time Lags Amid Global Change in Marine Observed and Dark Diversity on the Dogger Bank (North Sea)

DPF Trindade, A Knorrn, R Kreitsberg, J Fujinuma, CP Carmona, M Pärtel, M Sonnewald
PAPER
Mar 31, 2026

The Rapid Recovery of a Caatinga Dry Forest is Mediated by Disturbance-Adapted Species

AS de Paula, M Tabarelli, DPF Trindade, MF Barros, KF Rito, DG Souza, JC Sfair
PAPER
Jun 24, 2025

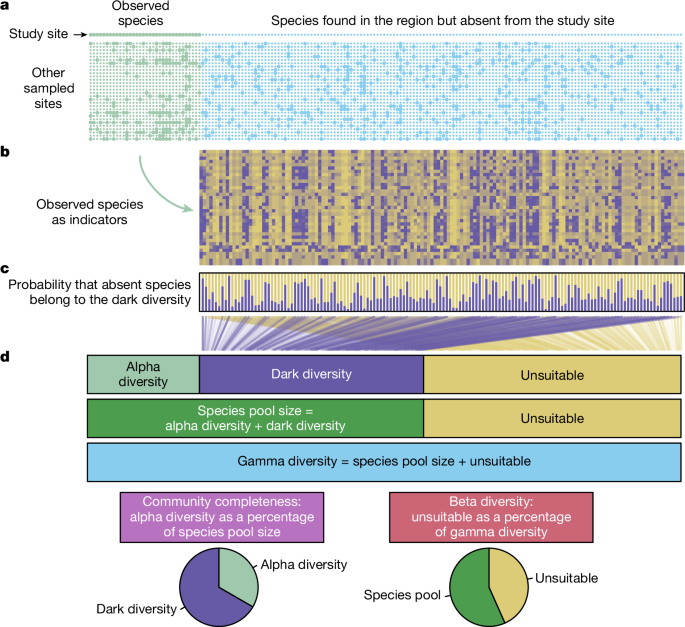
Global impoverishment of natural vegetation revealed by dark diversity

Meelis Pärtel, Riin Tamme, Carlos P. Carmona, (…) Diego P.F. Trindade, (…) Martin Zobel.
PAPER
Apr 2, 2025
No matching items

See All →

Posts

From Blogdown/Hugo to Quarto - deployed on Netlify

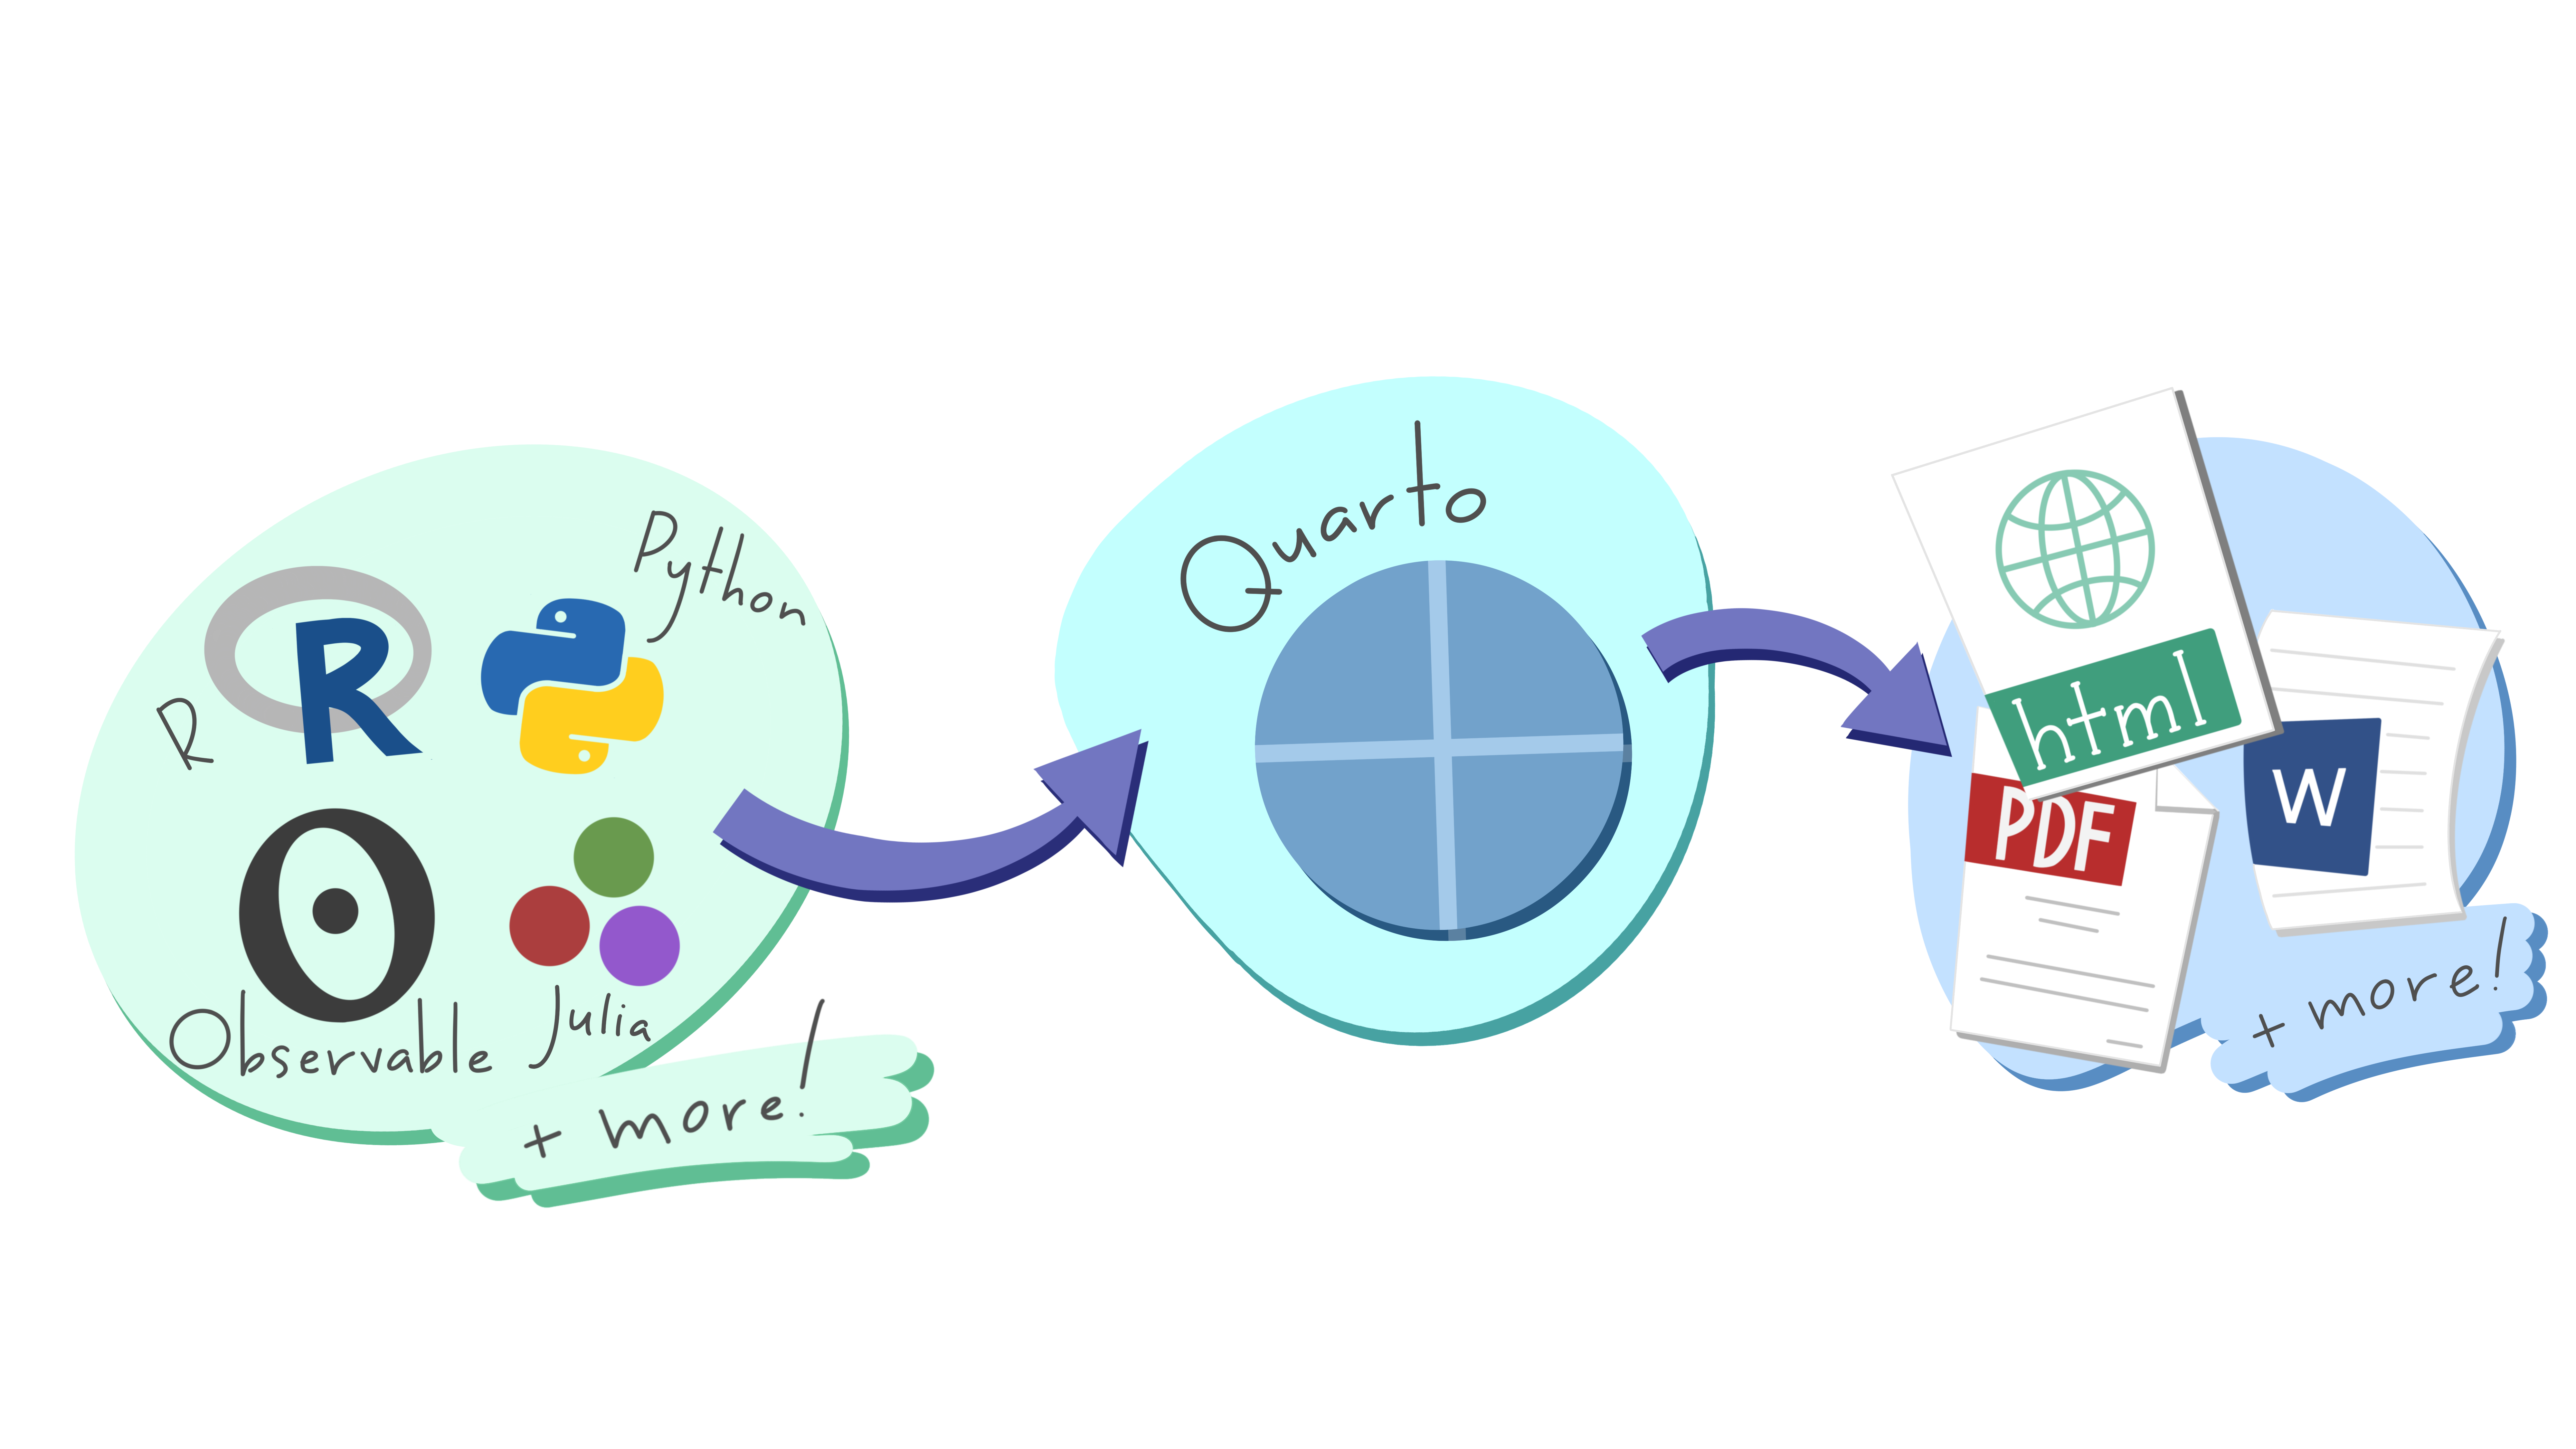
I’m perhaps a bit late to the Quarto party, but, after some delay, I decided overcoming my laziness and started to migrate my old blogdown/hugo website to Quarto.
May 15, 2023
Diego P.F. Trindade

3 Statistical analysis in ecology with broom

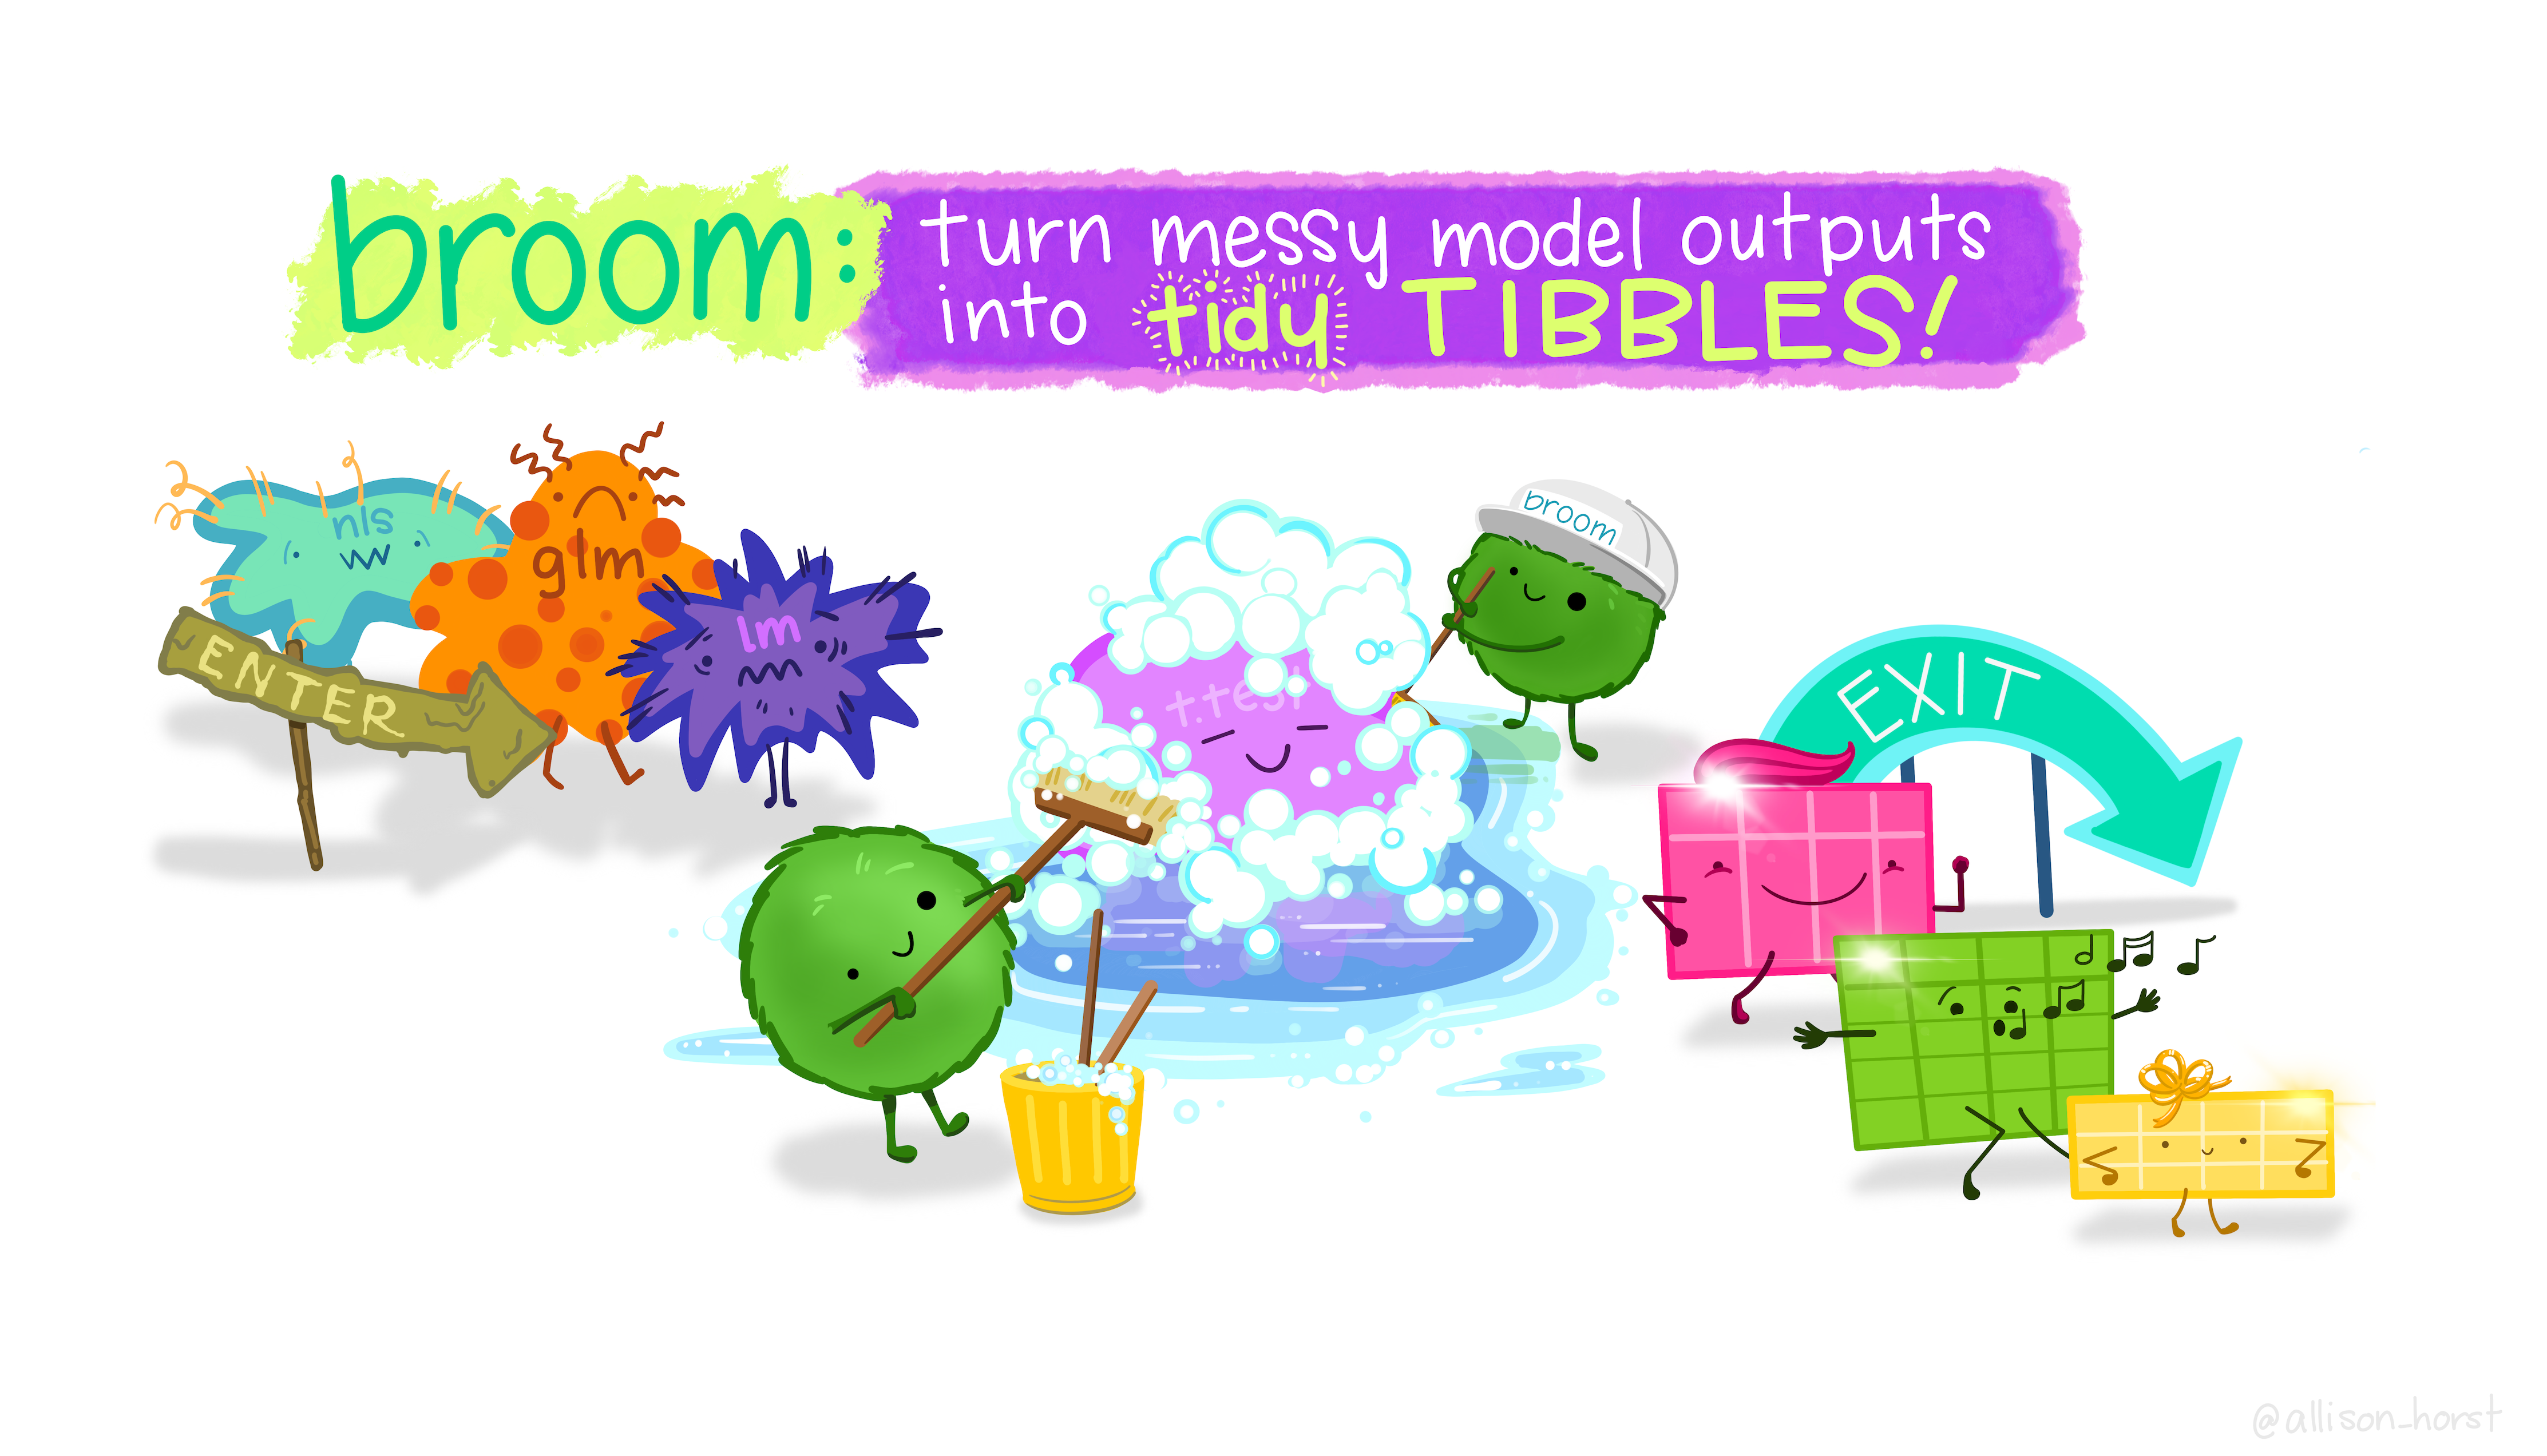
broom organizes the messy output we get from summary(model), giving us a tibble with different parameters present in our models. broom also supports working within lists, as we have seen in our previous posts. In short, when we need to perform several statistical analysis, with broom, we can nest the variables and run them all at once. To start, this package has three main functions tidy(), glance() and augment(). Each one gives us different parameters.
Jul 16, 2020
Diego P.F. Trindade

2 Data visualization with ggplot2

Besides being able to clean and explore data in ecology, it is also important to know how to visualize and present the patterns you found. Here I’m gonna show very briefly how to create histograms, bar plots, box plots and scatter plots with ggplot2. Further, I’m going through how to combine different plots using cowplot. I will try to use the knowledge we gathered in our previous post, i.e. using dplyr and purrr functions.
Jul 15, 2020
Diego P.F. Trindade
No matching items

See All →

 
Cookie Preferences